01
Alignment on data is alignment on the business
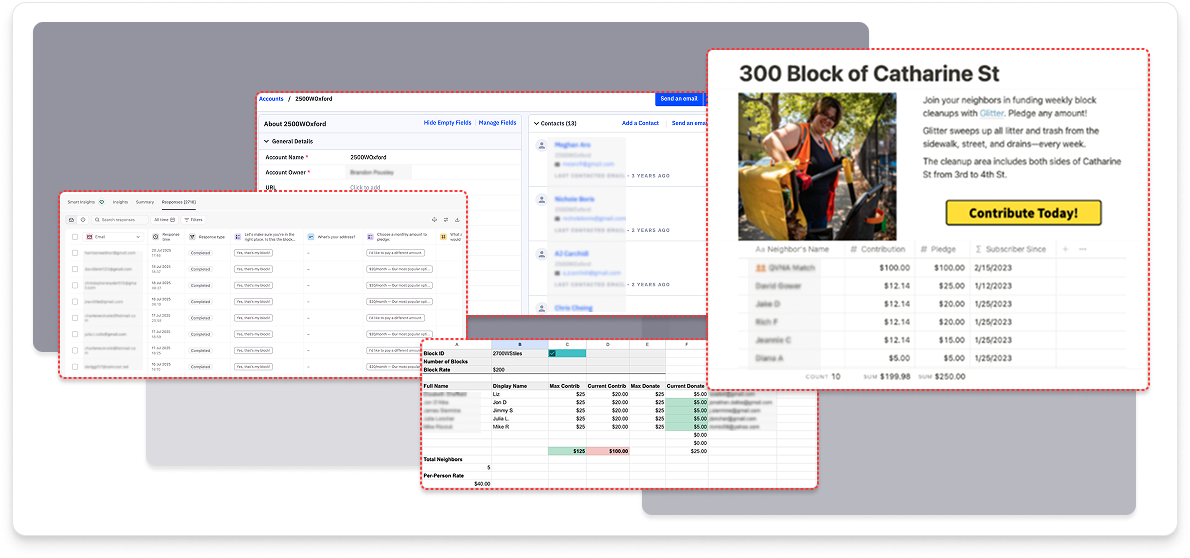
Getting stakeholders to agree on how data should be structured — what a "pledge" is, how a "contribution" relates to it, what counts as "funded" — was harder than building the tables themselves. That alignment work wasn't adjacent to product work. It was the product work.

definitions before schemas
02
The hidden cost of chaos is optionality
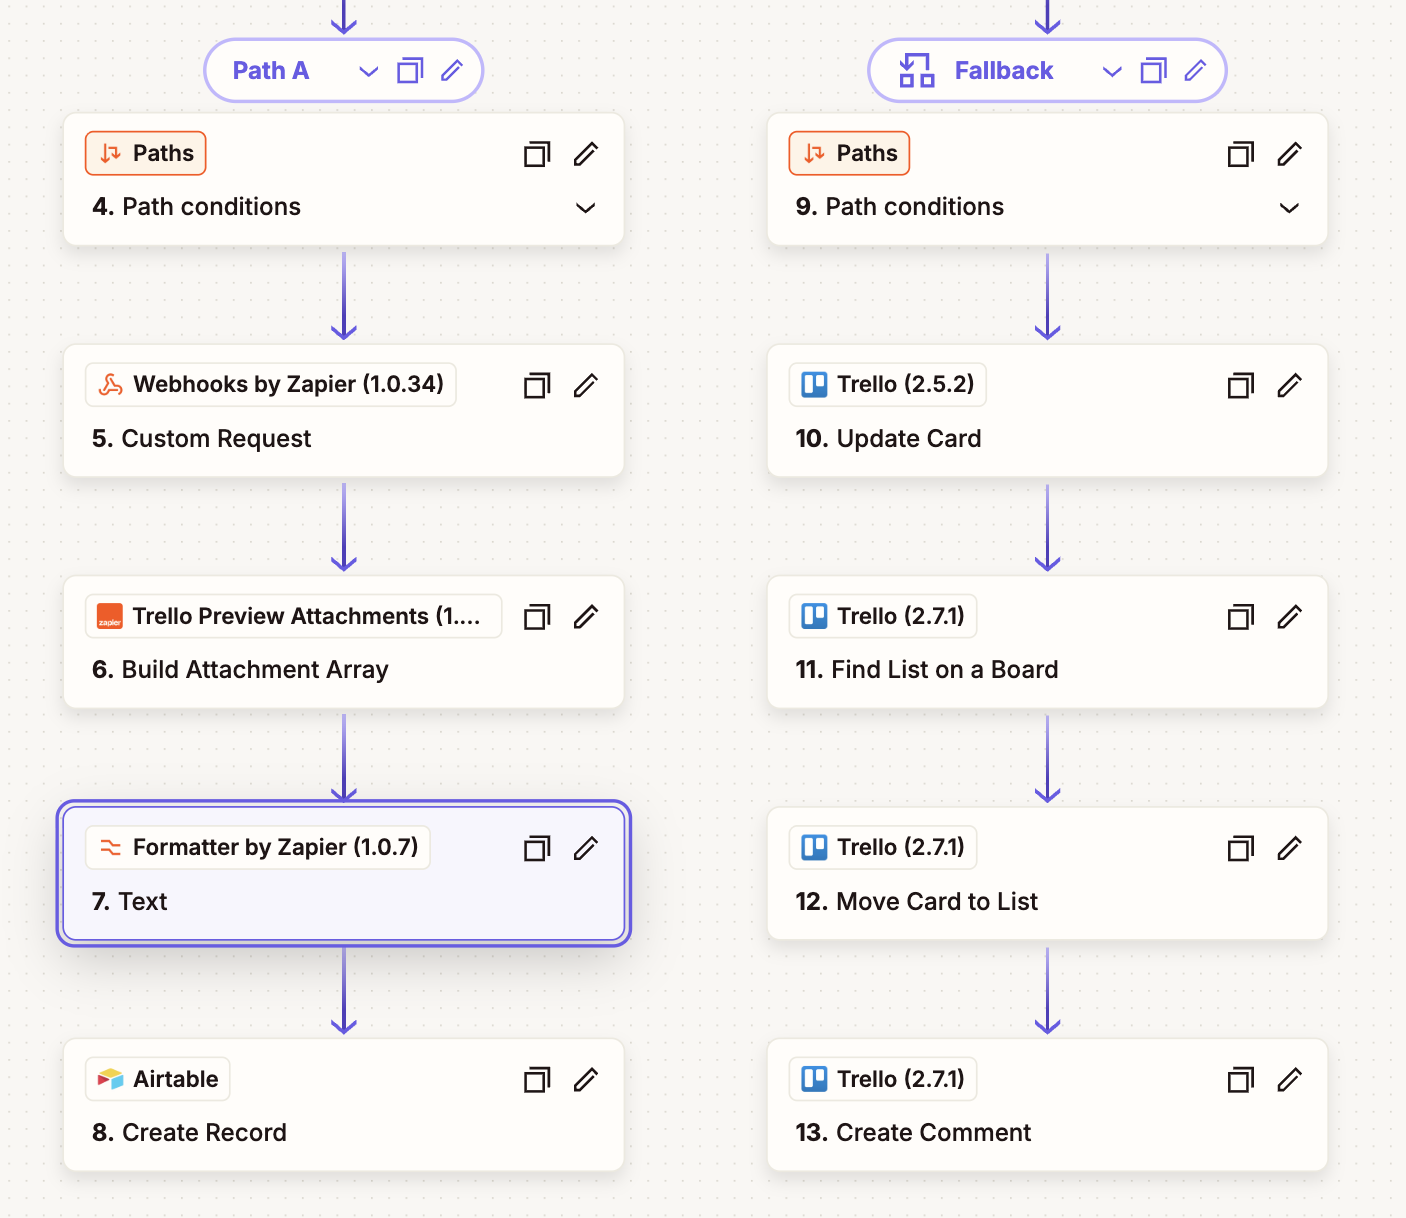
Fragmented systems don't just slow you down — they make entire categories of product decisions impossible once you scratch the surface. Real-time data, dynamic templating, grant reporting, and automated billing changes were all blocked until the architecture was in place. Solving the data problem unlocked the roadmap.
fix the foundation to unlock features
03
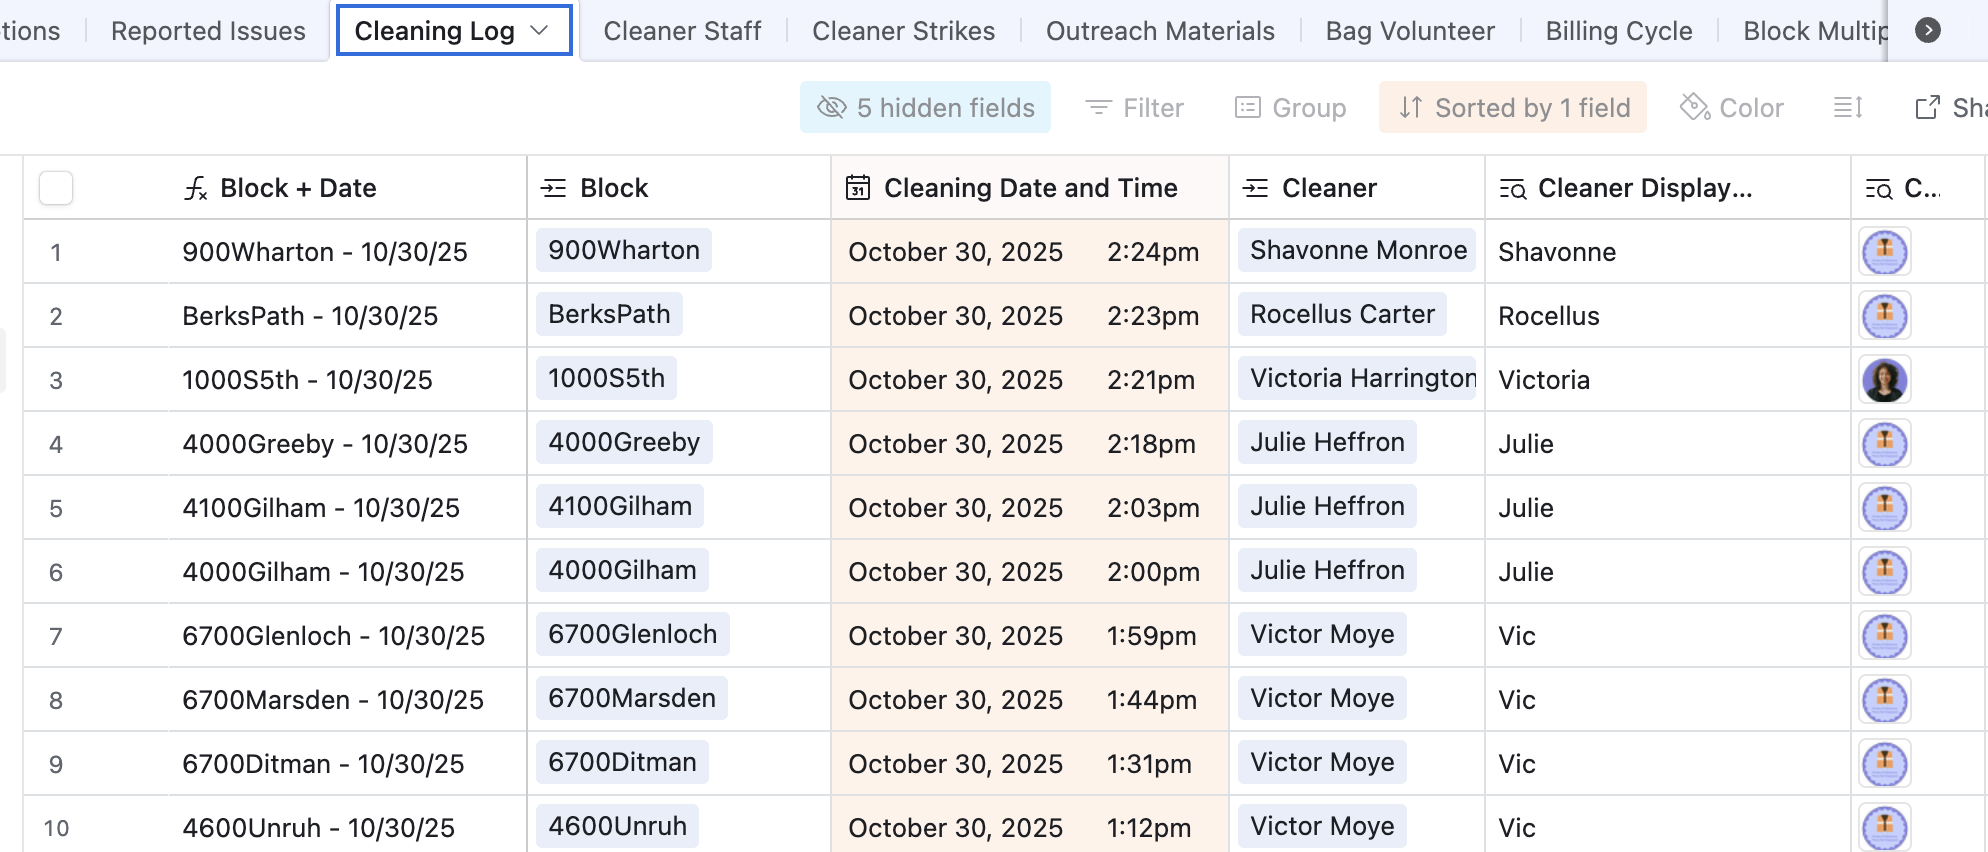
No-code is only as powerful as the data underneath it
Softr's dynamic capabilities are real, but they're entirely dependent on well-structured, relational data in Airtable. The product quality visible to the end user was a direct reflection of decisions made at the schema level. Design and data aren't sequential, they're co-designed.
schema = design
04
Build for the workflow, not just the tool
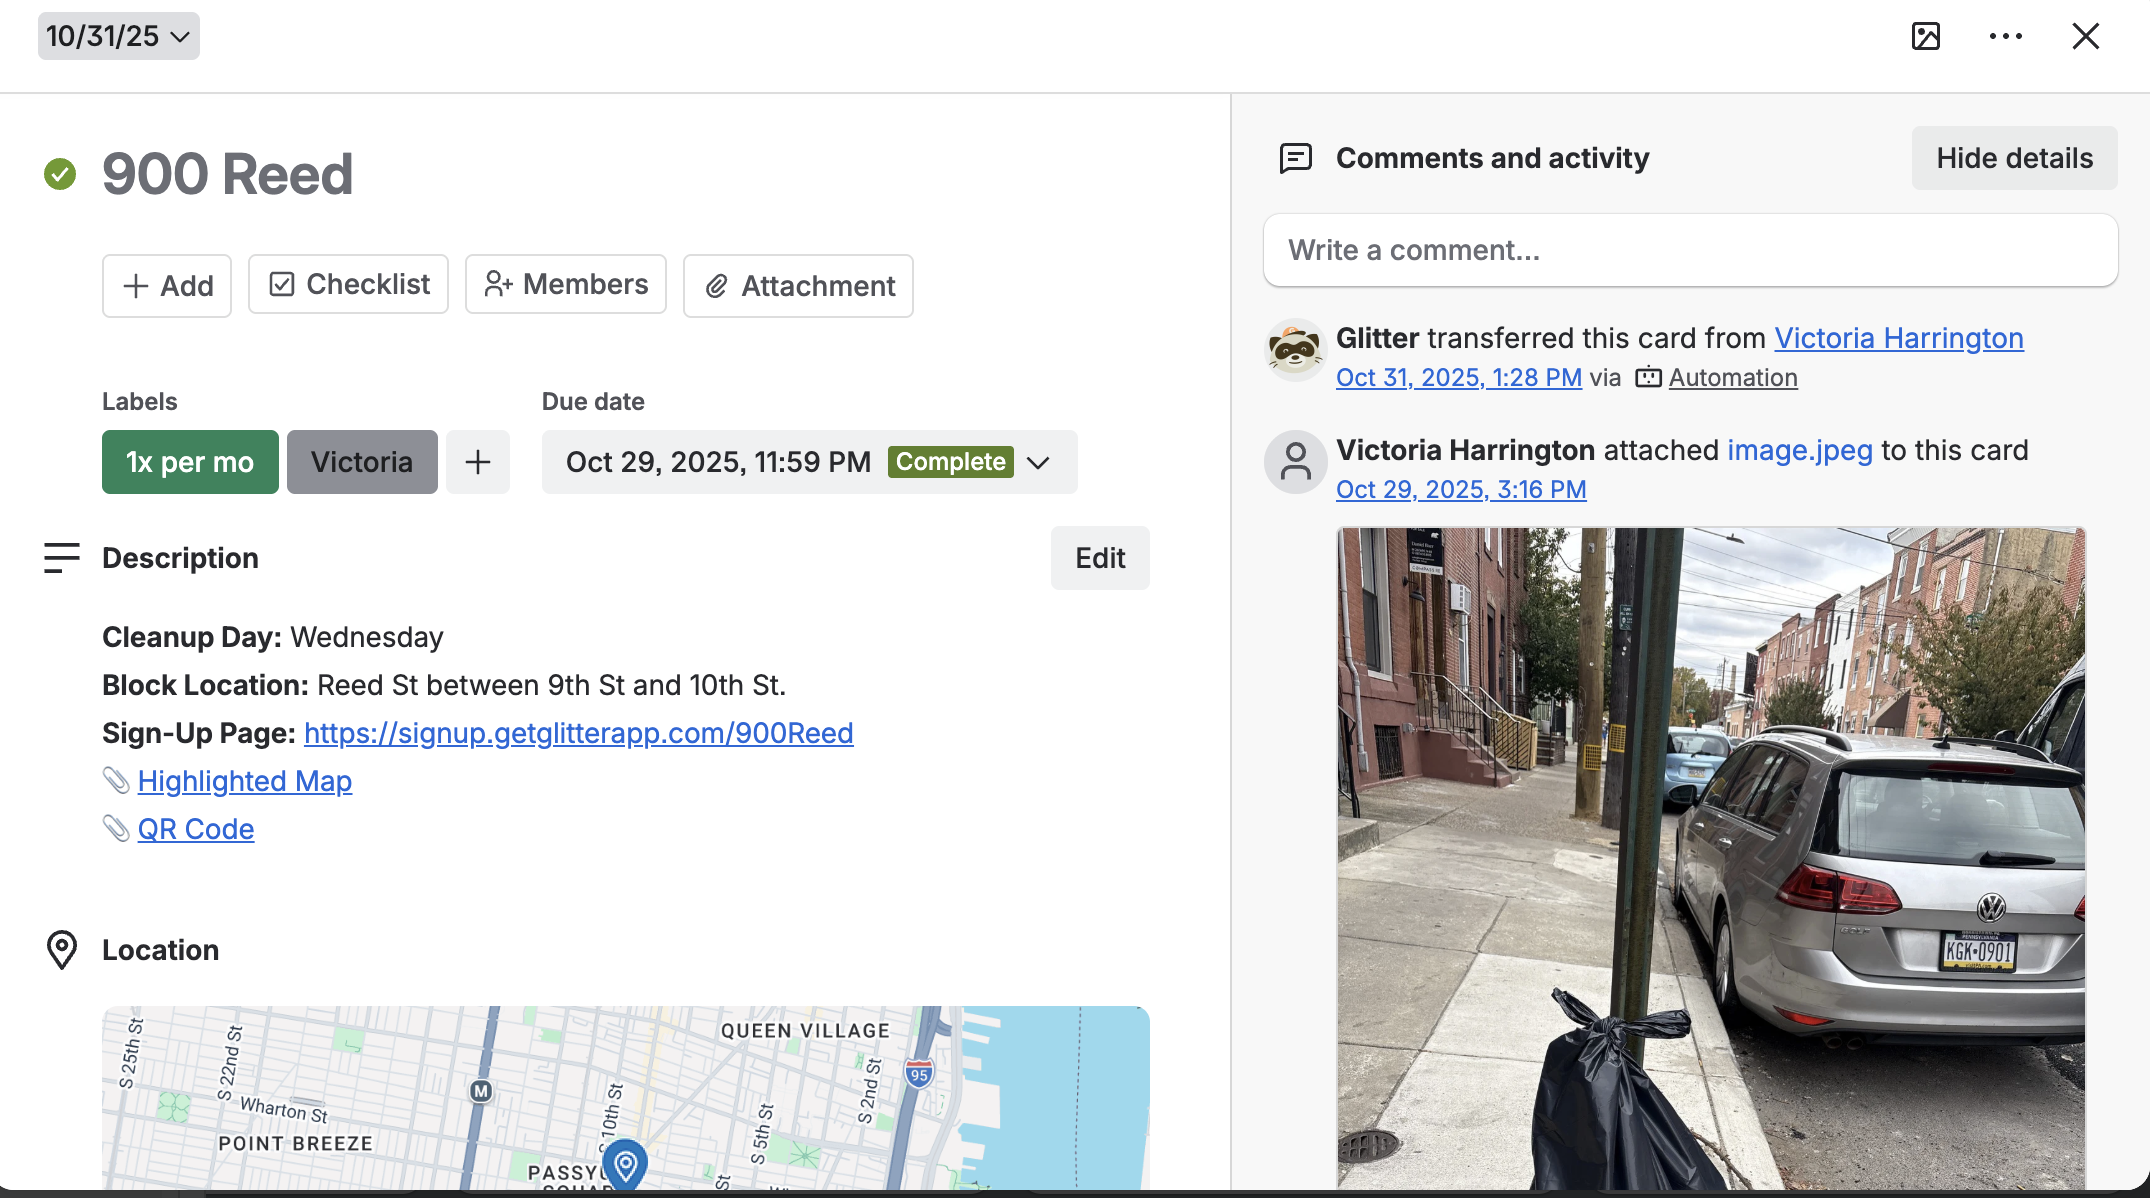
The real-time photo pipeline worked because it was designed around how cleaners actually operate in the field. The constraint of using tools the team already had became a feature: no new training, no adoption curve, just a better-connected version of existing behavior.
meet people where they are

.svg)